Bookings has two standard dashboards you can use to report on event attendance and income.
Controls

Both dashboards have the same controls. You can set:
- The date range - either the past seven days, the past month, or the past year, all counting from "yesterday", or a custom date range
- The events to report on
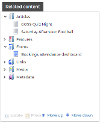
By default the events drop-down will include all articles using the event template that the current user has security permission to see (ie is a member of one of the user groups the event articles are secured to). The number in brackets is the event article ID.
You can restrict the dashboards to only report on certain events by relating event articles to the dashboard article. See "Setting up the Dashboards" below.
Attendance Dashboard

Each line on the dashboard represents one event, and displays a count of attendees for that event on each day within the reporting period. A table displays a summary of the data.
The following terms are used:
- Attended - A count of bookers checked in using the Booking Check-In form. If bookers aren't checked in using this form they won't be counted
- Attendance - The percentage of bookers who were checked in
- Bookings - The total count of bookers
- Assisted - The percentage of bookings made using Assisted Service
- Utilisation - The percentage of tickets available in the time period that were booked
In the example above the Quiz Night had three attendees on the 16th. There were three bookings, and everyone attended. There were 30 tickets available, so three bookings equals 10% utilisation.
Income Dashboard

Each line on this dashboard represents one event, and displays the total value of ticket sales for that event on each day within the reporting period. A table displays a summary of the data.
In the example above, the Pizza party sold £40 of tickets on the 1st, 5th and 6th of September, and £200 on the 12th, giving a total of £320, visible in the table.
Setting up the Dashboards
Each dashboard is a form.To display a dashboard, create an article using the Forms Service template and relate one of the dashboard forms to it.
The two forms are:
- BOOKANDPAYDASHBOARDWEEKLYVISITORS - Bookings attendance dashboard
- BOOKANDPAYDASHBOARDWEEKLYINCOME - Bookings income dashboard
To restrict a dashboard to only report on certain events, relate articles using the event template to your dashboard article. In this example, the Attendance Dashboard will only display data relating to the quiz night and football:


